
Understanding quality scorecards: A primer for boards
The number of public quality scorecards for hospitals has increased exponentially in recent years as consumers take more interest in getting the most value for their health care dollar. These attempts at simplifying the complex hospital environment into laypeople’s terms often condense hospital performance on a select number of quality measures into a letter grade, star or ranking — much easier for the average stakeholder to understand than risk-adjusted infection rates.
Hospitals have long supported transparency on quality information, and the emergence of the public report cards reflects consumers’ keen interest in understanding the quality of care in hospitals. At a time when hospitals, consumers and policymakers alike are focused on improving the value of care, quality data are crucial to ensuring that health choices are not based on lower prices alone.
The producers of these scorecards and reports, however, bear great responsibility in making judgment calls on behalf of consumers. The average patient won’t know whether a certain scoring methodology is truly reflective of the quality of care provided at a specific hospital or if the calculations behind the letter grade are statistically flawed and don’t show much about the provider at all.
In addition, the easy-to-understand nature of the scores carries the inherent risk of oversimplifying the complexity of delivering quality care: Each patient, doctor and hospital is unique and operates in an environment that is only partly comparable to every other patient, doctor and hospital. Finally, the proliferation of scorecards means that hospitals often receive discordant ratings across different reports, even when the reports are based on some of the same measures.
Questions also remain about how consumers are using quality information, though available studies suggest consumer uptake has been somewhat limited. Studies from Penn State University, the Harvard School of Public Health and Health Affairs have found that consumers actually are not likely to use these data: In 2008, while 30 percent of respondents reported seeing comparative quality data, only 14 percent said they used the information to choose a doctor, hospital or insurance plan. The same survey found that the primary users of this information were white, college-educated and older than 45; vulnerable populations, arguably those most in need of high-value care, were far less likely to read about provider quality.
Another study showed that, while awareness of physician quality has increased modestly over the past five years, there has been virtually no increase in awareness of hospital quality. Researchers cite information overload and a lack of personally relevant outcomes as reasons that consumers don’t actively use quality data.
That said, there are other incentives for hospitals and health systems to pay attention to quality scorecards. Like a personal résumé, a list of industry awards can make a hospital an appealing candidate for research grants, programs or philanthropic awards.
So, how should hospital boards consider these ubiquitous but often flawed scorecards? The first step is to know the main organizations proffering the scores, the methodologies they use and why a certain grade might not be what it seems.
Report cards 101
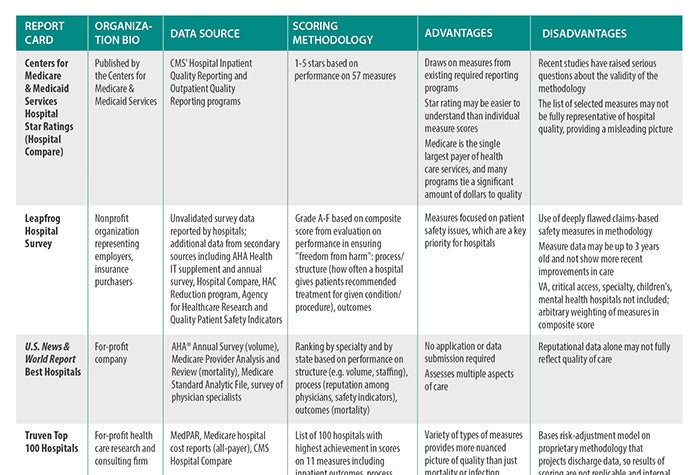
We have compiled a list of the most popular scorecards available in a table where you’ll see summaries of the important aspects of each report. Here's an explanation of how the table's categories work:
Organization bio: Even though they generally serve the same consumer/payer audience, scorecards are developed by several types of stakeholders. From government regulators and payers to nonprofit journals to for-profit, general-interest magazines, the authors of various scorecards differ somewhat in their motivations to publish quality data. Some are looking to promote high-value purchases by consumers (e.g., the Centers for Medicare & Medicaid Services' five-star quality rating system), while others use their background investigations into quality to call attention to providers they deem to be high-risk (e.g., ProPublica).
Data source: An evaluation is only as good as the data on which it is based; gathering data, however, can be expensive. Because of the cost and logistical difficulties, many organizations use publicly available data from CMS. Much of those data are collected from hospitals as part of CMS’ inpatient and outpatient quality reporting programs, which tie Medicare payment updates to reporting quality data. While CMS data capture a significant number of hospital interactions, the data are not necessarily representative of those for patients outside of the Medicare population. In addition, many individual measures in programs have significant flaws. Thus, where CMS uses a subpar methodology, the report card will, too.
Other organizations attempt to collect their own data, usually through surveys completed by hospitals. Self-reported surveys, however, can be suspect: Reporting differs by respondent (e.g., Who in the organization answered the survey? Where did that person obtain the information? How did he or she interpret the question?). Survey designs also are not always validated to ensure that they collect the intended information; surveyors struggle with incomplete or missing information. While there is no perfect source of data, some sources are more reliable than others.
Scoring methodology: The scoring methodology describes what areas of a hospital’s performance are evaluated — for example, mortality or infection rates — and how those rates are translated into a resulting score, grade or ranking. There is some overlap in the measures evaluated: Hospitals are generally graded based on their ability to keep patients alive (mortality rates) and safe (hospital-acquired condition rates). A few scorecards have begun to incorporate other aspects of quality, such as adherence to evidence-based processes and staffing ratios. Scorecards either determine a benchmark against which hospital performance will be judged — if performance is above the benchmark, the hospital gets a good grade — or rank hospitals in order of their outcomes.
The nature of this task — turning complex medical practice in multiple procedures, specialties and facilities into a single score — is inherently fraught. Many scorecards sacrifice accuracy and specificity for the sake of simplicity; for example, a scorecard might base an overall quality score on infection rates for one or two procedures because those are the data that are accessible, or use a select list of measures as a proxy for overall quality. Because hospitals vary significantly in what services they provide, however, those measures might not be relevant for a particular provider. In addition, a certain methodology might fail to control for certain factors that influence outcomes (e.g., the socio-demographic characteristics of the community in which the hospital operates) because it’s difficult to develop an algorithm to account for those factors.
Advantages/disadvantages: Finally, we’ve provided a summary of the strengths and weaknesses of these various scorecards. Strengths can be a unique point of view that highlights data that might be more relevant to patients seeking quality information, or a data-gathering approach that doesn’t pose an additional burden on hospitals. Weaknesses often are in the methodologies used to calculate grades or the limited scope of the report (e.g., leaving out certain kinds of providers or only looking at one type of safety indicator).
Board members should consider these characteristics when determining which scorecards, if any, they should incorporate into their strategies.
Hospitals have long supported transparency of quality data but have urged that consumers view report cards as one tool among many to inform their health care decisions. Consumers must consider the advantages and disadvantages of the design of each report card.
Furthermore, there is increasing concern that the growth in the number of report cards has created confusion for hospitals and consumers and that not all report cards use sound methodologies. To promote a more rational approach, the American Hospital Association, along with other national hospital associations, has endorsed a set of principles for developing public report cards, calling for them to be well-defined in purpose, to use valid measures and to have transparent methodologies [see “Guiding Principles for Public Reporting of Provider Performance”].
Trustee response
What can boards do with quality report cards?
Scorecards aren’t going away: Consumers want help distinguishing one hospital from another, and these reports offer the promise of synthesizing complex information for worried patients. Notwithstanding their flaws, public reports often draw attention from consumers and the media. Boards can help their organizations by asking questions about how the scorecards relate to the hospital’s broader approach to quality and what response they may have. Here’s where you can start:
- How does my board track my hospital’s quality of care? Do we consider internal metrics? Public scorecards?
- Does our board have a clear understanding of the scorecards we are using to track performance? What are the metrics designed to measure? What do the data indicate? What should board members be looking for when they review these reports, and what types of questions could they ask?
- Does our perception of our hospital’s quality (and our own internal data) match our scores/grades/rankings on public scorecards?
- Should we track how we perform on public scorecards as part of our organization’s internal performance tracking?
- What do our scores/grades/rankings suggest that we need to do? Introduce more quality initiatives? Improve our marketing?
- If we have scores on public reports that we do not like, are we prepared to respond to media inquiries? How can we showcase the good work that we do?
Caitlin Gillooley (cgillooley@aha.org) is associate director, policy, at the American Hospital Association.
© 2017 by the American Hospital Association (www.aha.org). Reprinted with permission.